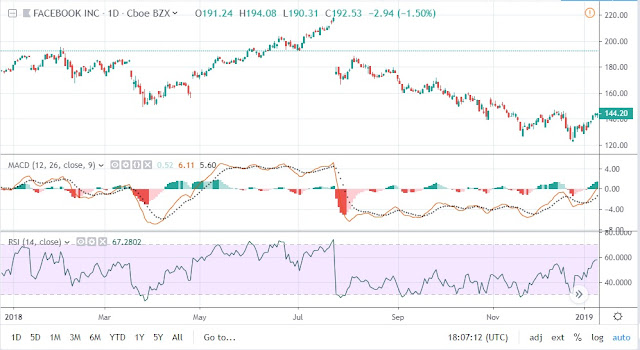
COMPARING FACEBOOK STOCK IN YEARS 2018 &2019
some technical analysis of FACEBOOK stock...
30-DAY & 200-DAY MOVING AVERAGE
The
indicator for the first four months of 2019 moves upward, so as 30-day moving
average which crosses below the 200-day moving average. That it's a sell signal, as it indicates that the trend is shifting down. This is known as a dead/death cross.
Trend
line acts like a floor (support), so the price (128.54) bounces up off of it, while acts
as resistance too; like a ceiling, the price (171.46) hits the level and then
starts to drop again. Support levels show that the investors believe that they
are the lowest acceptable prices, which means an upward should happen.
By contrast
to the above the same indicator for the first four months of 2018 moved downward
with support level 150.04 and resistance level 195.67. Generally in 2018 there are many downtrends
which are characterized by lower peaks and lower troughs over time. The 30-day moving average has similar route as the
indicator but 200-day moving average is more constant.
MACD & RSI INDICATORS
When MACD
crosses below the trigger line there is a buy signal. We notice that in 2018
and 2019 too there are many times that MACD and trigger line crossed and MACD
has similar route as the indicator. However the MACD of 2019 is over the zero
line while in 2018 a large part of MACD is under the zero line. When MACD and
the indicator have converse routes the trade is converse too.
The RSI
indicator when is not in the purple area (30%-70%) and it is over 70% it has to
be over-bought but when in under 30 it has to be over-sold. When RSI crosses
over 30% then we may have a buy signal, but when RSI crosses back below 70% we
may have a sell signal.
SPX ANALYSIS
In
conclusion we notice that the route of FACEBOOK stock in 2019 is way better
and accretive than 2018.
Sources:


Comments
Post a Comment